
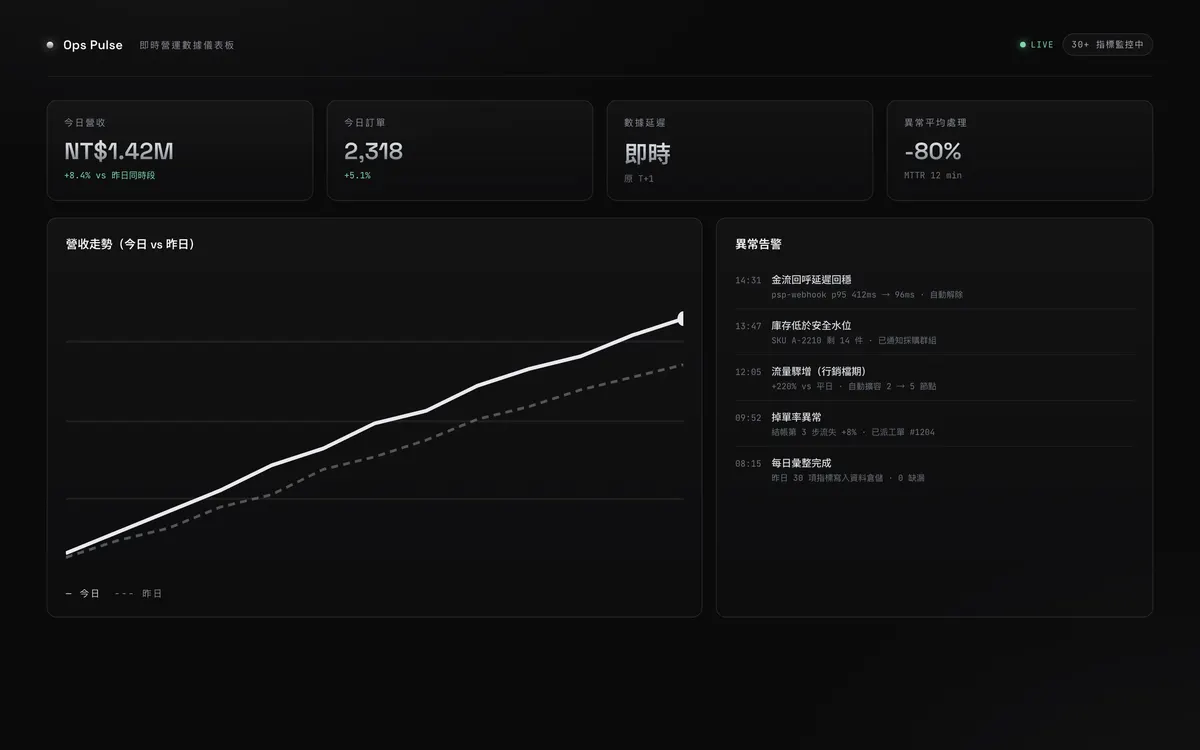
Realtime operations dashboard
Live KPIs with automated anomaly alerts.
Cloud Infrastructure
Challenge
Leadership saw yesterday’s numbers the next day; anomalies — dropped orders, stockouts, traffic dips — were often discovered hours after they happened.
Solution
Built a pipeline streaming events from every system into a warehouse, a dashboard for live KPIs and trends, and rule-based anomaly alerts pushed straight to the management channel.
Process
Metrics before machinery
Sat down with leadership to define which metrics actually matter and what counts as anomalous for each — instead of putting every available number on a wall. A dashboard gets opened daily only when it is few and sharp.
Pipeline & one source of truth
Events stream from every system into the warehouse, with time zones, currencies and definitions normalised in the pipeline — every number on the dashboard traces back to the same facts, ending the cross-department numbers debate.
Alert tuning
After go-live, alert thresholds were tuned weekly against real false-positive rates until every alert genuinely warranted action — an alert channel that cries wolf is worse than none.
Deliverables
- Realtime data pipeline
- KPI dashboard
- Anomaly alert rules
- Historical trend analysis
Results
- Livelatency (was 1 day)
- -80%anomaly MTTR
- 30+live metrics
FAQ
Yes — that is exactly what the pipeline solves. Each system connects however it can (API, database link or exports), and time zones, currencies and definitions are normalised in the pipeline. Sources come online in priority order, so you start using the dashboard before everything is connected.
Realtime is a dial, not a default: minute-level latency covers most operational metrics at a fraction of the cost of second-level streaming. Each metric’s refresh rate follows how often decisions actually get made on it — you never pay for immediacy nobody uses.
Metric definitions and alert thresholds ship documented, and day-to-day operation needs no engineering babysitting. New metrics can be added under an ops arrangement with us — or by your own team, which we train at handover.
Have something similar in mind? Tell us about it
Start a projectThis case is anonymised to protect client contracts and privacy.